Interpreting Histograms Worksheet
ADVERTISEMENT
 1
1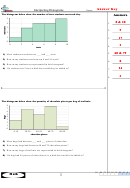 2
2Name:
Interpreting Histograms
The histogram below show the number of texts students sent each day.
A n s w e r s
5
8 & 10
4
1.
3
5
2.
2
1
17
3.
0
0
2
4
6
8
10
2
4.
texts
60 & 79
5.
1) Most students sent between ___ and ___ texts.
2) How many students sent between 8 and 10 texts?
8
6.
3) How many students are represented in this histogram?
24
4) If a student sent 2 texts which bar would they be added to?
7.
3
8.
The histogram below show the quantity of chocolate pieces per bag of trail mix.
8
7
6
5
4
3
2
1
0
0-19
20-39
40-59
60-79
80-99
chocolate pieces
5) Most bags had between ___ and ___ pieces of chocolate.
6) How many bags had between 60 and 79 chocolate pieces?
7) How many bags of trail mix are represented in this histogram?
8) If a bag had 59 pieces of chocolate in it, which bar would it be added to?
1-8
88 75 63 50 38 25 13 0
Math
1
ADVERTISEMENT
0 votes
Related Articles
Related forms


Related Categories
Parent category: Education