Interpreting Histograms Worksheet
ADVERTISEMENT
 1
1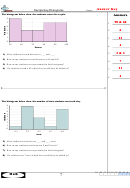 2
2Name:
Interpreting Histograms
The histogram below show the students scores for a quiz.
A n s w e r s
6
50 & 60
5
1.
4
6
3
2.
2
22
1
3.
0
50
60
70
80
90
100
4
4.
Scores
2 & 3
5.
1) Most students scored between a ___ and ___.
2) How many students scored between a 50 and 60?
7
6.
3) How many students are represented in this histogram?
21
4) If a student scored a 80 which bar would they be added to?
7.
4
8.
The histogram below show the number of texts students sent each day.
8
7
6
5
4
3
2
1
0
0-1
2-3
4-5
6-7
8-9
texts
5) Most students sent between ___ and ___ texts.
6) How many students sent between 8 and 9 texts?
7) How many students are represented in this histogram?
8) If a student sent 7 texts which bar would they be added to?
1-8
88 75 63 50 38 25 13 0
Math
7
ADVERTISEMENT
0 votes
Related Articles
Related forms


Related Categories
Parent category: Education