Meteorology Worksheet Page 4
ADVERTISEMENT
 1
1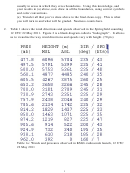 2
2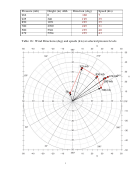 3
3 4
4Figure 2: Blank hodograph paper.
(a) Fill in Table 1b with the wind directions and speeds extracted from the
radiosonde information in Table 1a; (2 pts each for 24 points)
(b) Plot an arrow (vector) for each level given in Table 1b, as shown in class.
Label each arrow near its end with the appropriate level (for example, Sfc). (2
pts each for a total of 10 pts)
(c) Put a black dot at the tip of each arrow; (2 pts each for a total of 10 pts)
(d) Draw (neatly) straight line segments connecting each dot. (5 pts)
(e) In plain english describe how the the wind in the lowest 6 km, as visualized
by the hodograph you just constructed, varied with height. (21 pts)
The winds change in a clockwise sense from the surface to around the 700
mb level, and then a slight counterclockwise change and then straight. The
winds also generally increasd with height except between 850 mb and 700
mb. Also, noteworthy, is that the surface wind is nearly right angles to the
wind in the middle troposphere.
4
ADVERTISEMENT
0 votes
Related Articles
Related forms


 Worksheet A - Residency Information Worksheet For Nonresidents/part-year Residents, Worksheet B - Income Allocation Worksheet For Nonresidents/part-year Residents, Worksheet C - Employee Apportionment Worksheet
Financial
Worksheet A - Residency Information Worksheet For Nonresidents/part-year Residents, Worksheet B - Income Allocation Worksheet For Nonresidents/part-year Residents, Worksheet C - Employee Apportionment Worksheet
Financial
 - Residency Information Worksheet For Part-year Residents/nonresidents/") Worksheet A/worksheet B (form 1040me) - Residency Information Worksheet For Part-year Residents/nonresidents/"safe Harbor" Residents/income Allocation Worksheet For Part-year Residents/nonresidents/"safe Harbor" Residents
Financial
Worksheet A/worksheet B (form 1040me) - Residency Information Worksheet For Part-year Residents/nonresidents/"safe Harbor" Residents/income Allocation Worksheet For Part-year Residents/nonresidents/"safe Harbor" Residents
Financial
 Worksheet Ct-1040aw - Part-year Resident Income Allocation Worksheet, Employee Apportionment Worksheet - 1998
Financial
Worksheet Ct-1040aw - Part-year Resident Income Allocation Worksheet, Employee Apportionment Worksheet - 1998
Financial
 - Standard Deduction, Worksheet Vi-qmip - Qualified Mortgage Insurance Premiums Deduction, Worksheet Vi-idl - Itemized Deduction Limitation - 2014") Worksheet V (form 2) - Standard Deduction, Worksheet Vi-qmip - Qualified Mortgage Insurance Premiums Deduction, Worksheet Vi-idl - Itemized Deduction Limitation - 2014
Financial
Worksheet V (form 2) - Standard Deduction, Worksheet Vi-qmip - Qualified Mortgage Insurance Premiums Deduction, Worksheet Vi-idl - Itemized Deduction Limitation - 2014
Financial
 Worksheet A And B - Residency Information Worksheet For Part-year Residents/nonresidents/"safe Harbor" Residents/income Allocation Worksheet For Part-year Residents/nonresidents/"safe Harbor" Residents
Financial
Worksheet A And B - Residency Information Worksheet For Part-year Residents/nonresidents/"safe Harbor" Residents/income Allocation Worksheet For Part-year Residents/nonresidents/"safe Harbor" Residents
Financial


Related Categories
Parent category: Education