Probabilities And Venn Diagrams Worksheet Template
ADVERTISEMENT
 1
1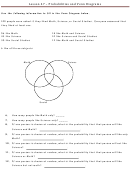 2
2 3
3 4
4Lesson 47 – Probabilities and Venn Diagrams
Use the Venn Diagram below to answer question #1 – 5.
Rap
Rock
11
18
24
7
8
1
17
Country
1.
How many total people are represented in the diagram? ____
2.
How many people like country? _____
3.
If one person is chosen at random, what is the probability that that person will like rap
music?
P (rap) =
4.
If one person is chosen at random, what is the probability that that person will like
country or rock music?
P(country or rock) =
5.
If one person is chosen at random, what is the probability that that person will like
country and rock music?
P(country and rock) =
ADVERTISEMENT
0 votes
Related Articles
Related forms


Related Categories
Parent category: Education