Sunsmart Uv Alert
ADVERTISEMENT
 1
1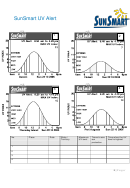 2
2SunSmart UV Alert
Recommended AusVELS Level: 3 - 6
Recommended Strands:
Instructions
Health & Physical Education
Personal learning
1. Go to the Bureau of Meteorology website at
The Humanities – Geography
English
Click on the location in the map of Victoria
Mathematics
closest to your area.
Science
A new box pops up with the SunSmart UV
Communication
Alert graph for that area.
Design, Creativity and Technology
Can you answer these questions about the
Thinking Processes
graph?
Today’s date:
You will need:
Access to internet (Bureau of
The SunSmart UV Alert location:
Meteorology and SunSmart websites)
What will be today’s highest (maximum)
Green, yellow, orange, red and purple
UV level?
pencils or textas.
What colour in the UV index range is
today’s maximum UV?
Important information
The SunSmart UV Alert lets you know daily
When will the maximum UV level be
local sun protection times. It uses UV Index
reached?
information from the Bureau of Meteorology.
When will today’s UV level be 3 or more
The UV Index indicates how much UV from
for your area? From _____ to _______
the sun is reaching the earth. UV levels of 3
or more can start to damage a person’s skin
What are today’s sun protection times for
and eyes and can lead to skin cancer. It’s
your area? From _____ to _______
important to always use sun protection
What colour is used to show when the UV
(clothing, hat, sunscreen, shade, and if you
can, sunglasses) whenever UV levels reach
is below 3?
3 or more to help protect your skin and
When is sun protection NOT needed
eyes.
today? Before_____ and After _______
The UV Index is divided into categories from
2. Look at the SunSmart UV Alerts on page 2
low (1-2) to extreme (11+). Each range is
Use the coloured pencils / textas to fill in the
represented by a different colour.
UV Index range and the bell curves for each
UV index range:
SunSmart UV Alert.
Low (0–2) Green
Fill in the information on the table. Do you
know which state or territory each of these
Moderate (3–5) Yellow
locations are in?
Which parts of Australia would have the
High (6–7) Orange
highest UV levels? Why?
Very high (8–10) Red
3. Now go to
Extreme (11+) Purple
Can you find the SunSmart UV Alert on
SunSmart’s homepage? (Hint: It doesn’t look
Low UV levels are usually safe for most
like the bell curve graph and it’s blue!)
people but moderate, high, very high and
extreme can be dangerous.
This is called a widget and can be added to
your school’s website.
The SunSmart UV Alert graph uses a bell
Use the drop down list to find the sun
curve to show the changing UV levels
protection times for your area today.
across the day. The bell shape of the graph
has a high curve in the middle of the day.
That’s when UV levels are highest.
ADVERTISEMENT
0 votes
Related Articles
Related forms


Related Categories
Parent category: Education