Graphing Exponential Functions Worksheet Page 2
ADVERTISEMENT
 1
1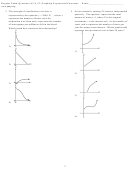 2
2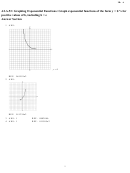 3
3Regents Exam Questions A2.A.53: Graphing Exponential Functions
Name: ________________________
3 The strength of a medication over time is
4 An investment is earning 5% interest compounded
quarterly. The equation represents the total
−x
represented by the equation y = 200(1.5)
, where x
amount of money, A, where P is the original
represents the number of hours since the
investment, r is the interest rate, t is the number of
medication was taken and y represents the number
years, and n represents the number of times per
of micrograms per millimeter left in the blood.
year the money earns interest. Which graph could
Which graph best represents this relationship?
represent this investment over at least 50 years?
1)
1)
2)
2)
3)
3)
4)
4)
2
ADVERTISEMENT
0 votes
Related Articles
Related forms


Related Categories
Parent category: Education